End-to-end telemetry using Azure Application Insights
Implementing a centralized logging and metrics tracking across all your application’s components is challenging. Azure Application insights makes this easy and can be integrated with your front-end code and back-end to give you an end-to-end logging and performance analysis.
Azure app insights has many great features, I recommend you take a look at the full list here, for now let’s take a look at some of my favorite :
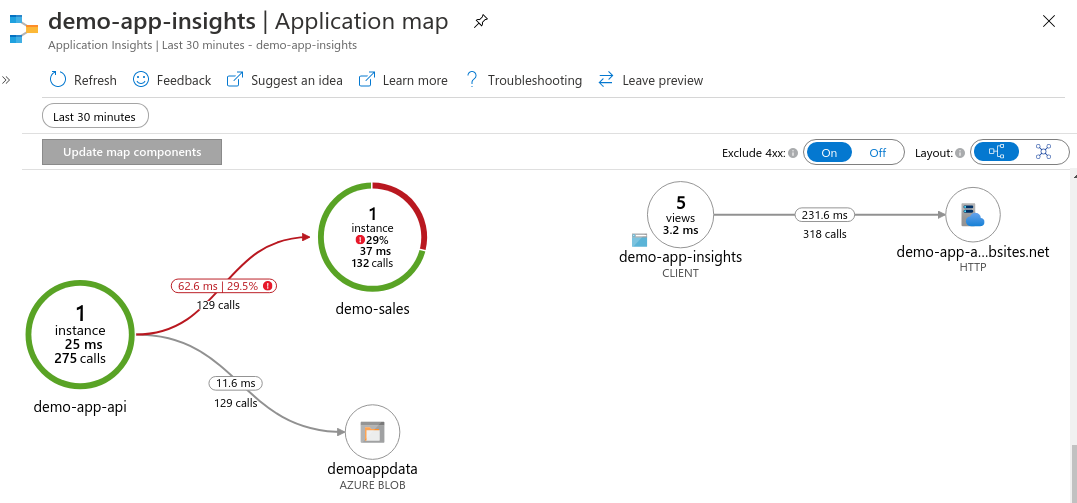
- Application Map This is one of my favorite features of application insights, it provides a visual diagram of components and it’s dependencies with a very clean representation of the key metrics and with ability to drill-down on a single part or dependency if needed.
- Live Metrics Stream In this view you see logs and metrics as they come in, so you are able to analyze and react them on the fly and not have to wait for the data to be digested
- KQL (Kustro Query Language) Some times I find my self looking for something very specific that the previous features do not provide or I just have a very specific question I need an answer to With KQL you can Query the logs to get pretty much an answer to any logs related question you might have. Hell you can even build charts directly using KQL
For this article I am going to add end-to-end monitoring to this web application
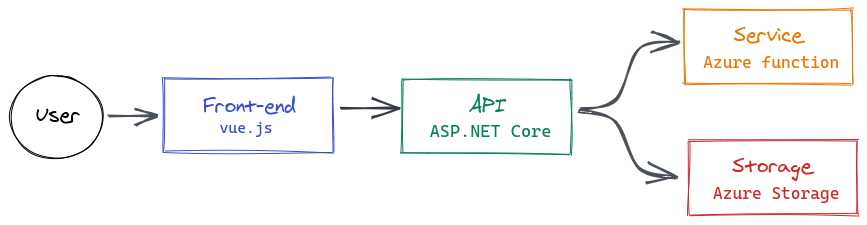
As you can see the Front-end is built using Vue.js, which is talking to an API deployed on Azure Web Service that is using an SQL database, a Blob Storage and an external API.
You can checkout the full code for the applications used in this post on Github.
1. Create an Application Insight resource #
The first thing you should do is head to the Azure portal and create a new resource application insight, this is the central resource that will receive the logs and metrics. You will only have few basic parameters to specify. A step-by-step guide from Microsoft to create one.
Once you’ve created the resource, you should take note of the Instrumentation Key, you will need it for the rest of this demo.
2. Client-side #
The example I am using in this demo is a Vue.js application based on Nuxt.js framework. And luckily there is a module I can use to quickly add telemetry to the application.
All I have to do is add @nuxtjs/applicationinsights dependency using yarn to the project
yarn add @nuxtjs/applicationinsights
And then add @nuxtjs/applicationinsights to modules section of nuxt.config.js
{
  modules: [
    '@nuxtjs/applicationinsights',
  ],

  appInsights: {
    instrumentationKey: '<InstrumentationKey>' //  your project's Instrumentation Key here
  }
}
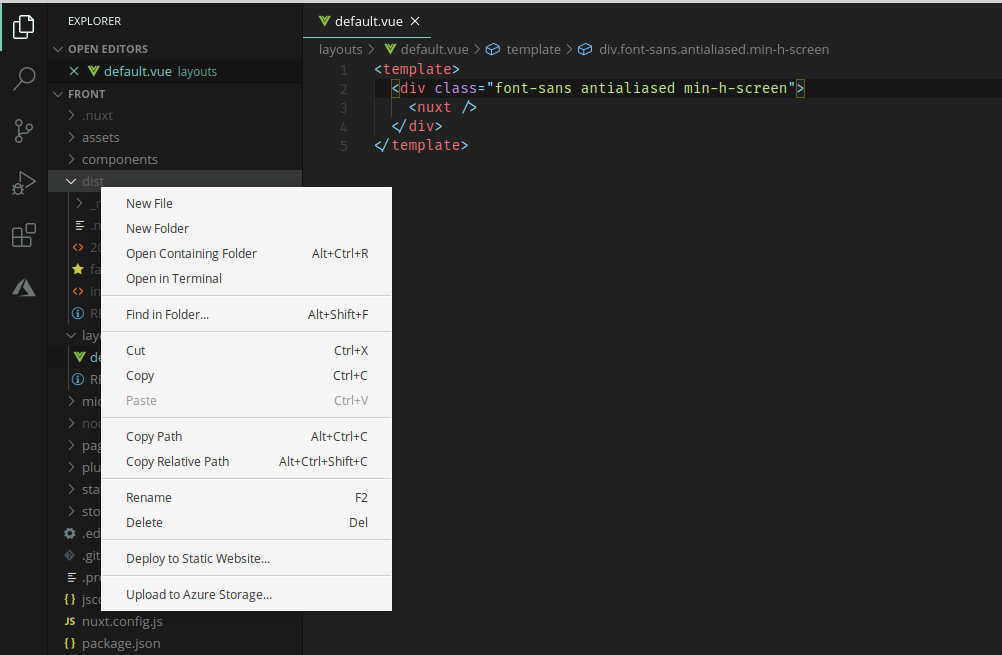
Now build and deploy the app to your static site hosting, for me I used Azure blob storage to host this, so I just go to VS Code, right click on dist folder and select Deploy Static Site
Once done, open the URL a couple of times in the browser to generate some trafic.
Head to the application insight → On the left panel click on Metrics
You can then set the time range to the last 30 minutes
And build a metric like I did here Metric: Page views and Aggregation: Sum
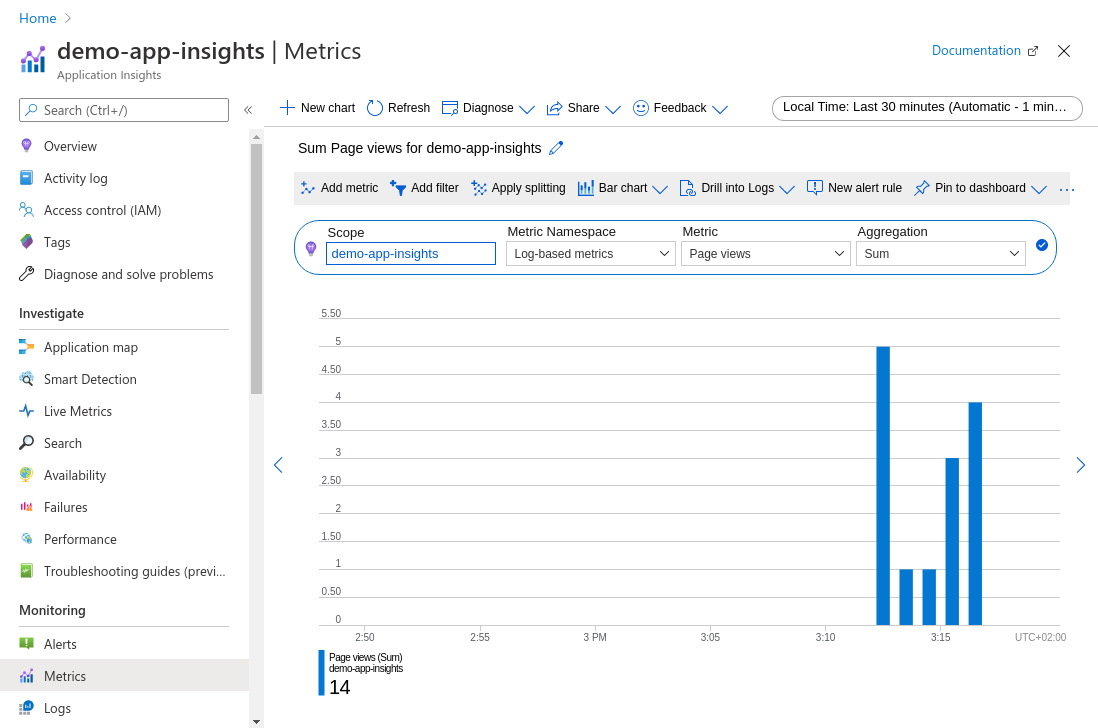
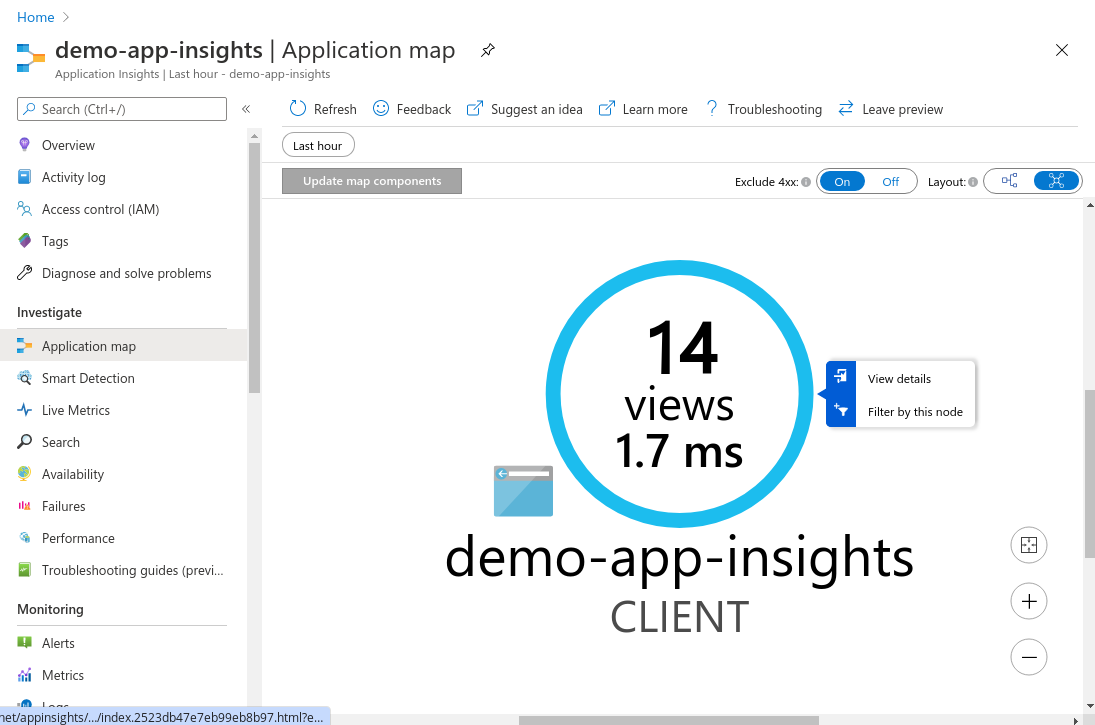
Now if you go to Application map you’ll be able to see that the Client application is now showing up, with some high level aggregated metrics like in the example below : 14 Views with an average duration of 1.7 milliseconds
3. Server-side #
Our front-end uses an API to get some data whenever I click on of the two buttons. the api is built using asp net core. So in order to add telemetry to the server side we will have to setup Azure app insights on our dotnet app.
Same as we did with the front end, we will first have to add a package
dotnet add package Microsoft.ApplicationInsights.AspNetCore
Then enable telemetry service in the startup.cs file
// Enables Application Insights telemetry
services.AddApplicationInsightsTelemetry();
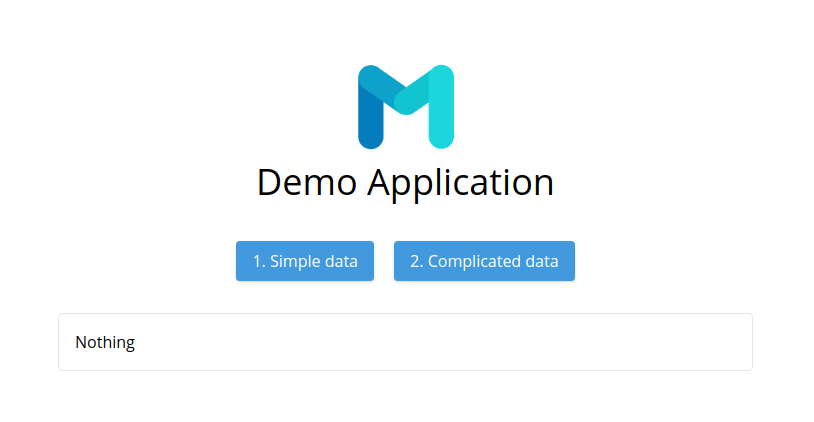
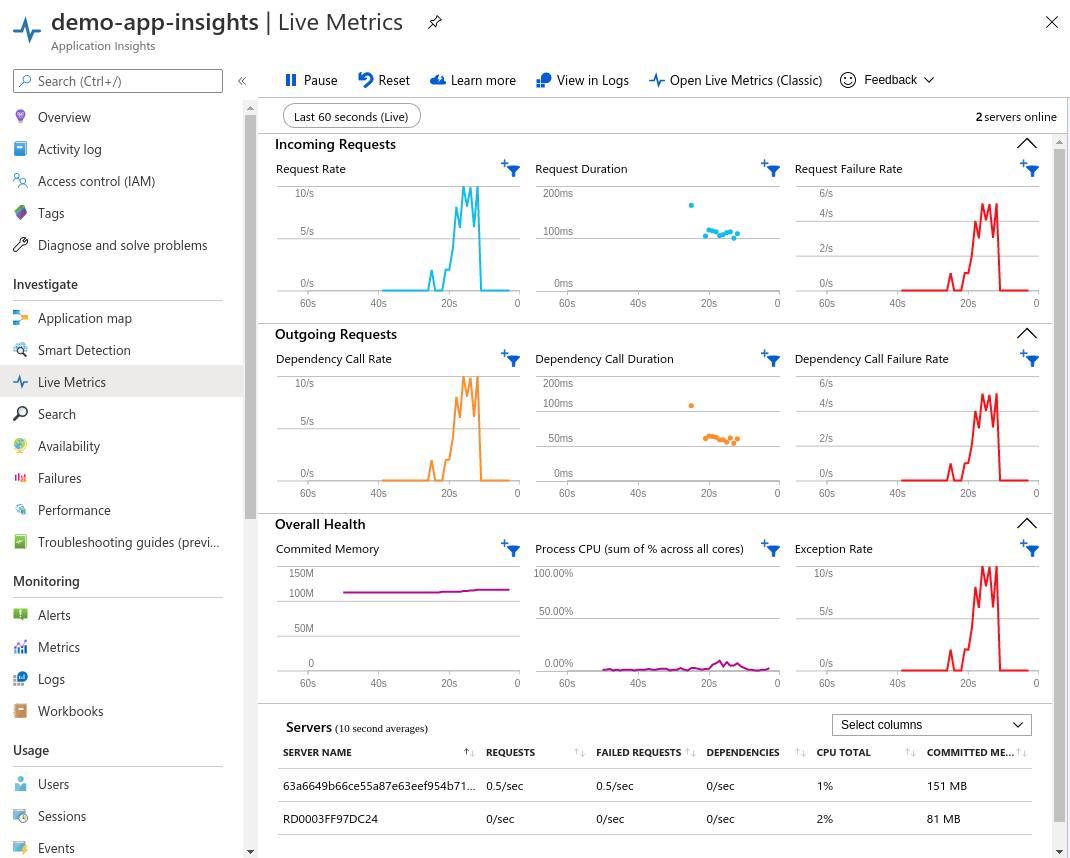
Now deploy, and open Azure portal, go to application insights and open Live Metrics once there try to generate some traffic by clicking on the buttons “Simple data” and “Complicated Data”, or you can hit the api url directly using your favorite REST client
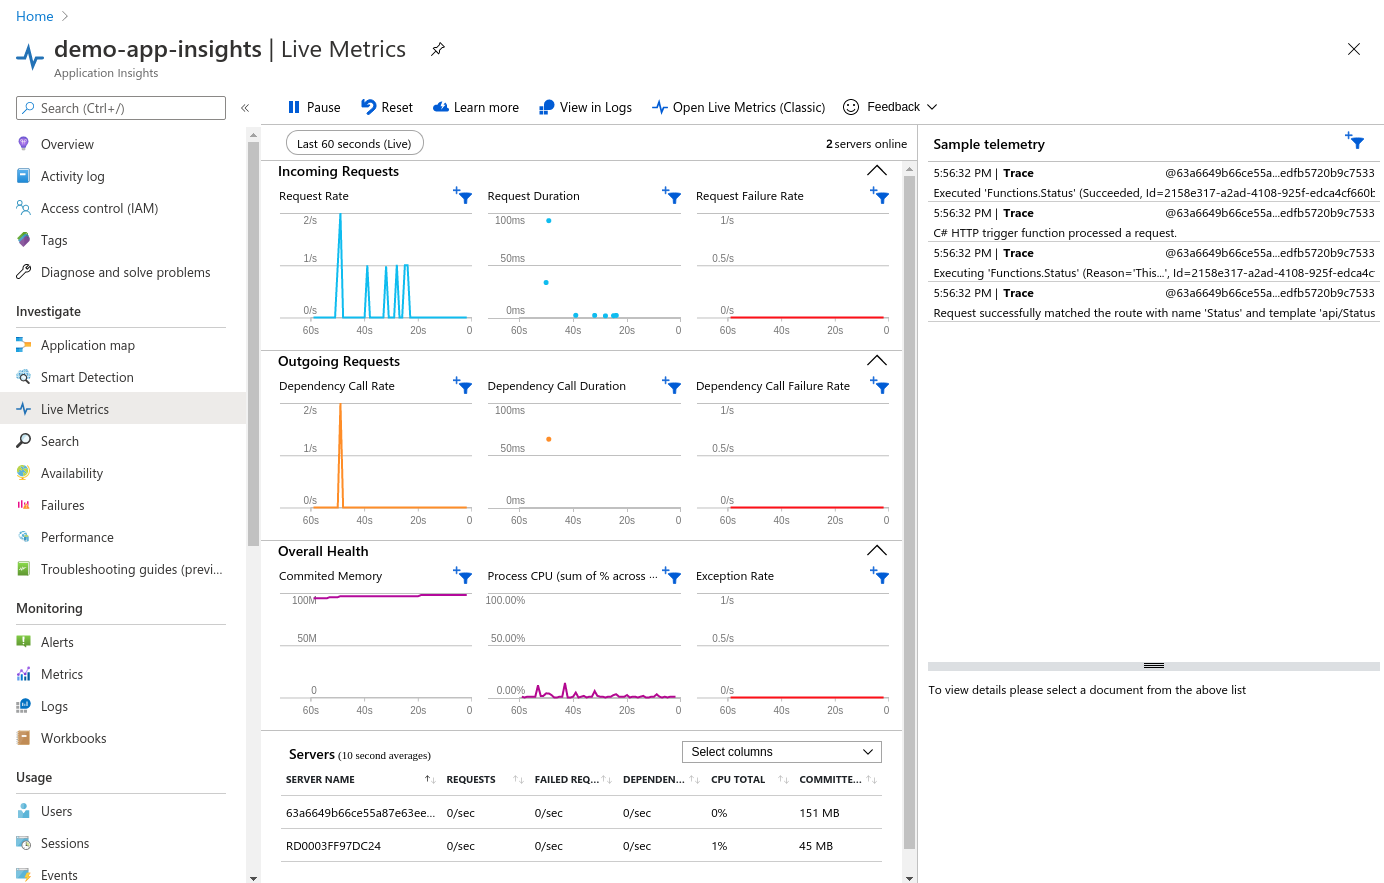
Each time I do this and get the graph spike I have a little smile on my face 🙂
So now the Server-side metrics are showing up, let’s go take a look at the application map now to see that the application insight mapped out the dependencies.
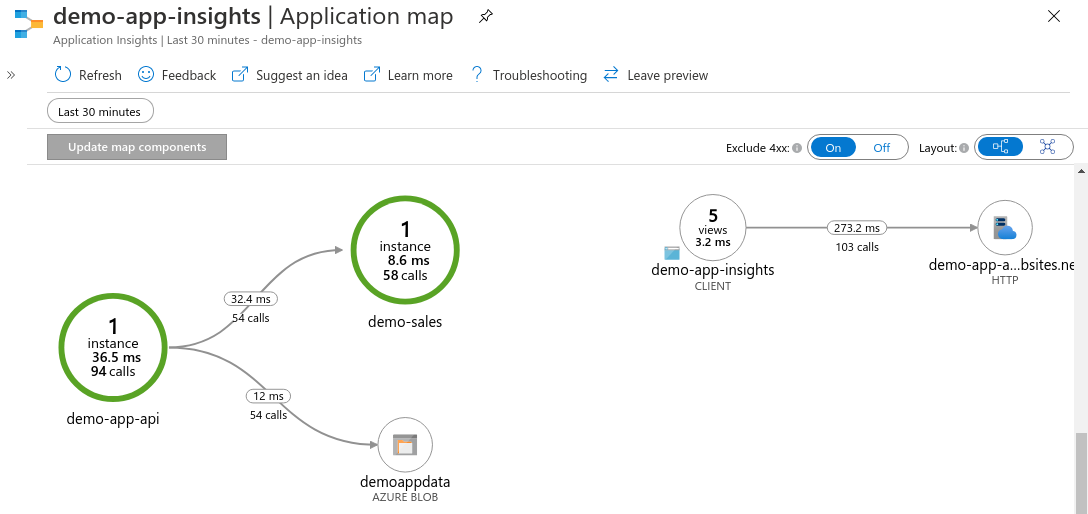
What you see here are the components and dependencies between them that application insight detected.
On the right is the Front-end Client interacting with the Back-end server where the API is hosted
On the left it’s the API on the server that is talking to the other services, one of them is the Blob storage, and the other one is the Azure function (demo-sales)
I am not sure why it’s not detecting that the API is the same as the backend server, but let’s not worry about that right now.
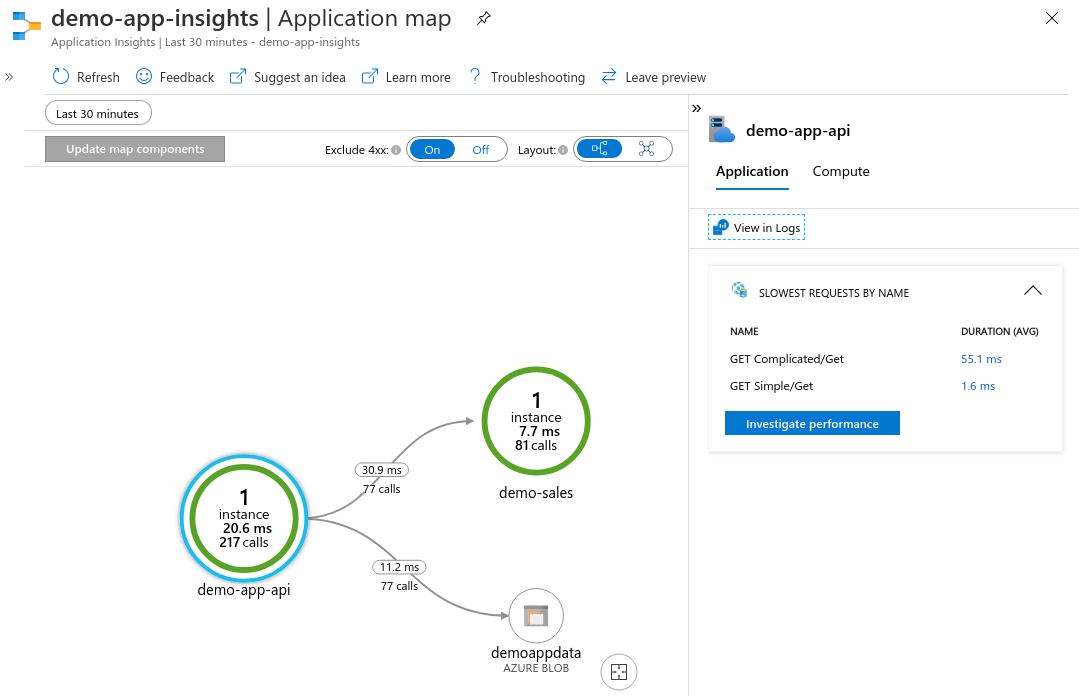
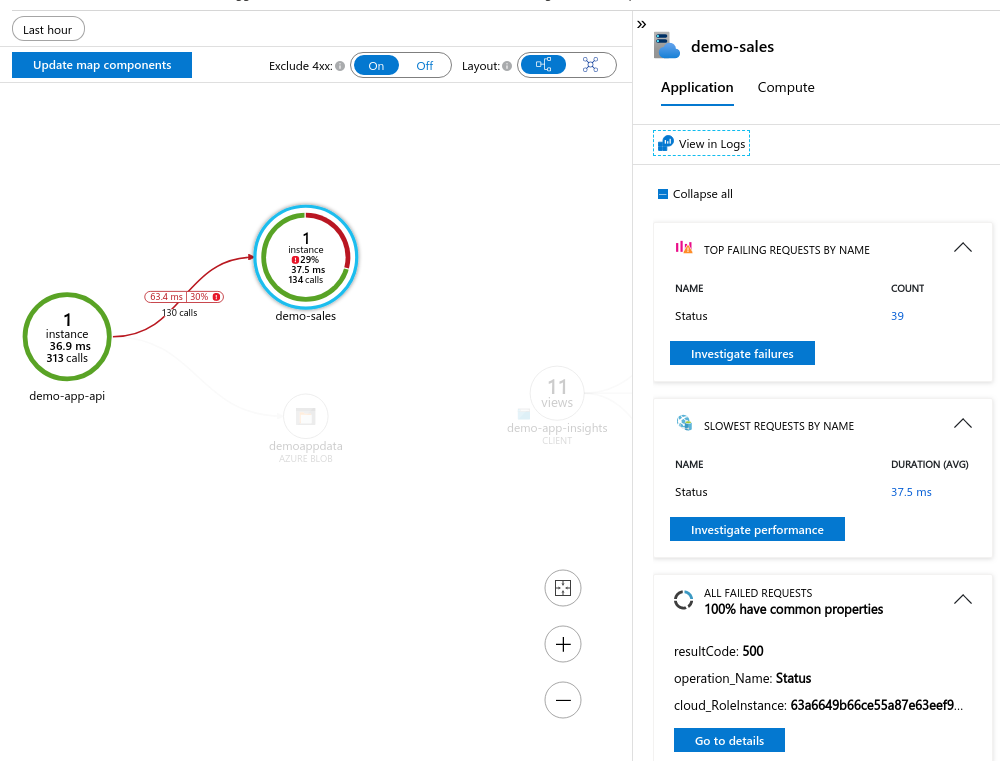
If you click on any of the components you will get some details, like in the example below where I clicked on the demo-app-api, and you can see on the right that the average duration for the complicated route is 55.1 ms and 1.6 ms for the Simple one.
What if there are errors in one of the components? #
I changed the Azure function code to throw an exception, and clicked on the button a couple of times while the live metrics is open, as you can see the number of failed requests is spiking.
And if you open the Application Map again you will get a very nice view of where the problem is occurring and also a nice representation for the percentage of failed requests
If you click on the component with the errors now, you will get some “insights” about the common properties of the requests that failed
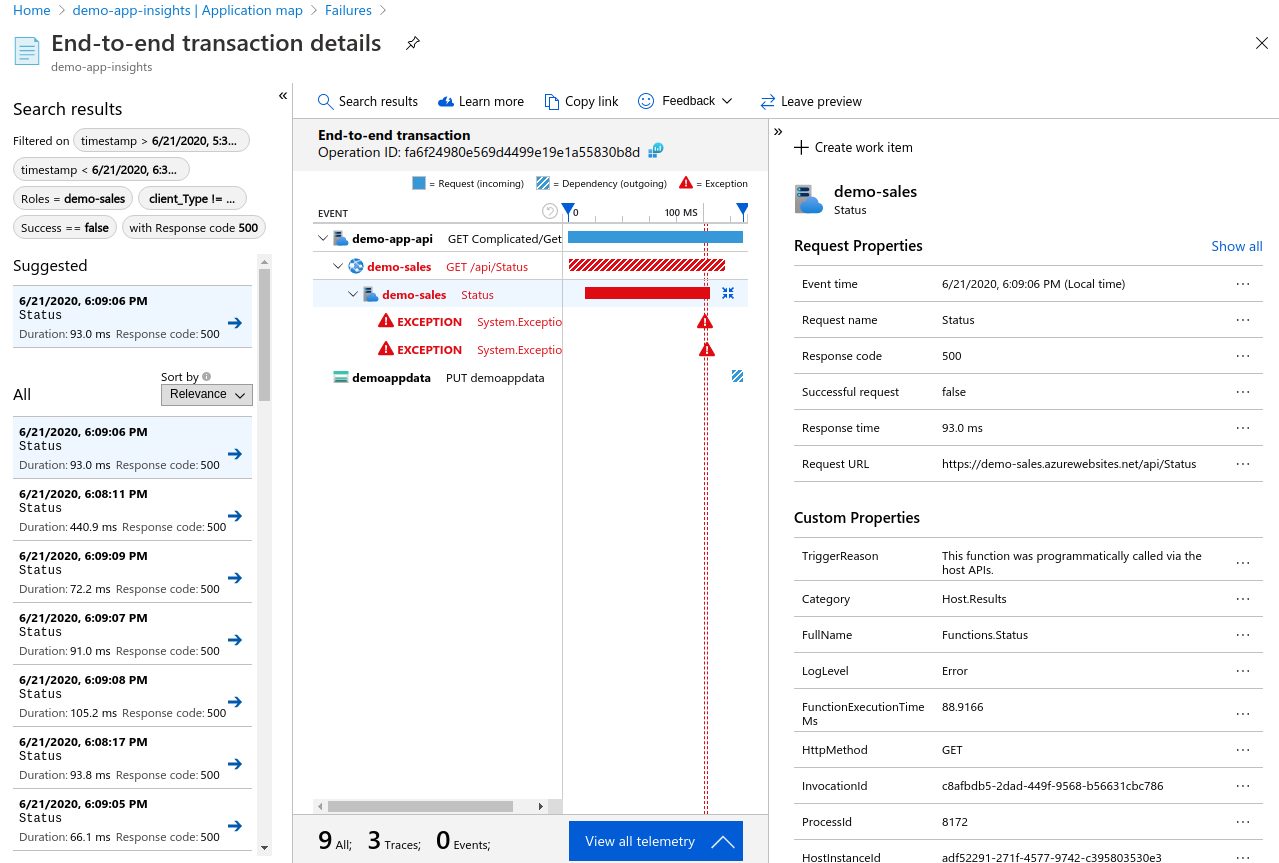
or you can click on investigate failures to get what’s called End-to-end transaction details which is very helpful and might even make you identify the issue without having to debug locally or for when you can’t really reproduce the scenario leading to the issue.
As you can see it’s very easy to integrate app insights into your application and once that’s done you can use it to map out your dependencies and keep an eye on the latency and performance of the different components of your application.
In the next article we might take a look at configuring alerts based on these metrics so you will be notified for any issues or problems that might happen.